
Statistics and insights
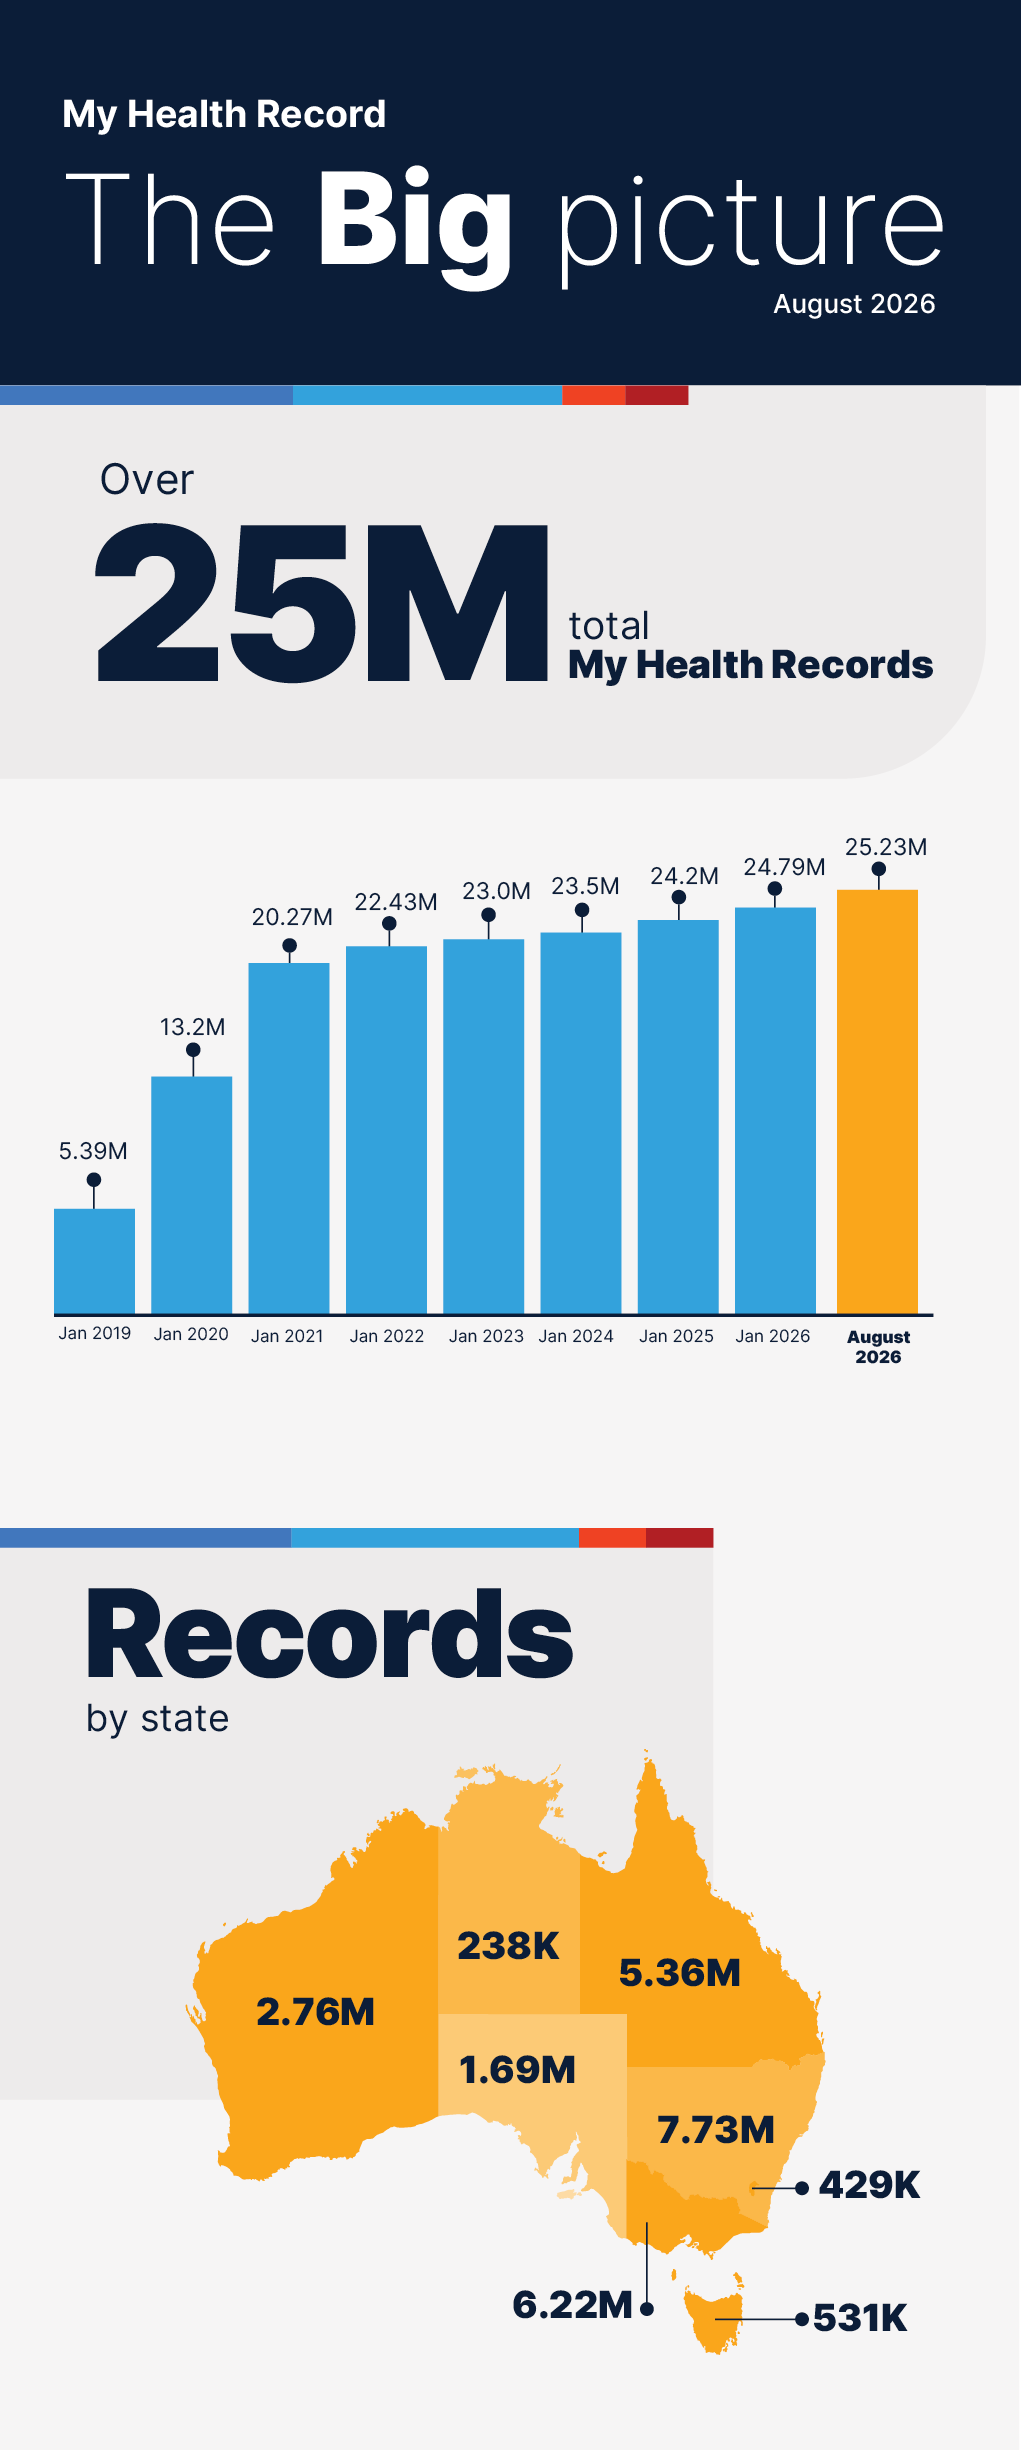
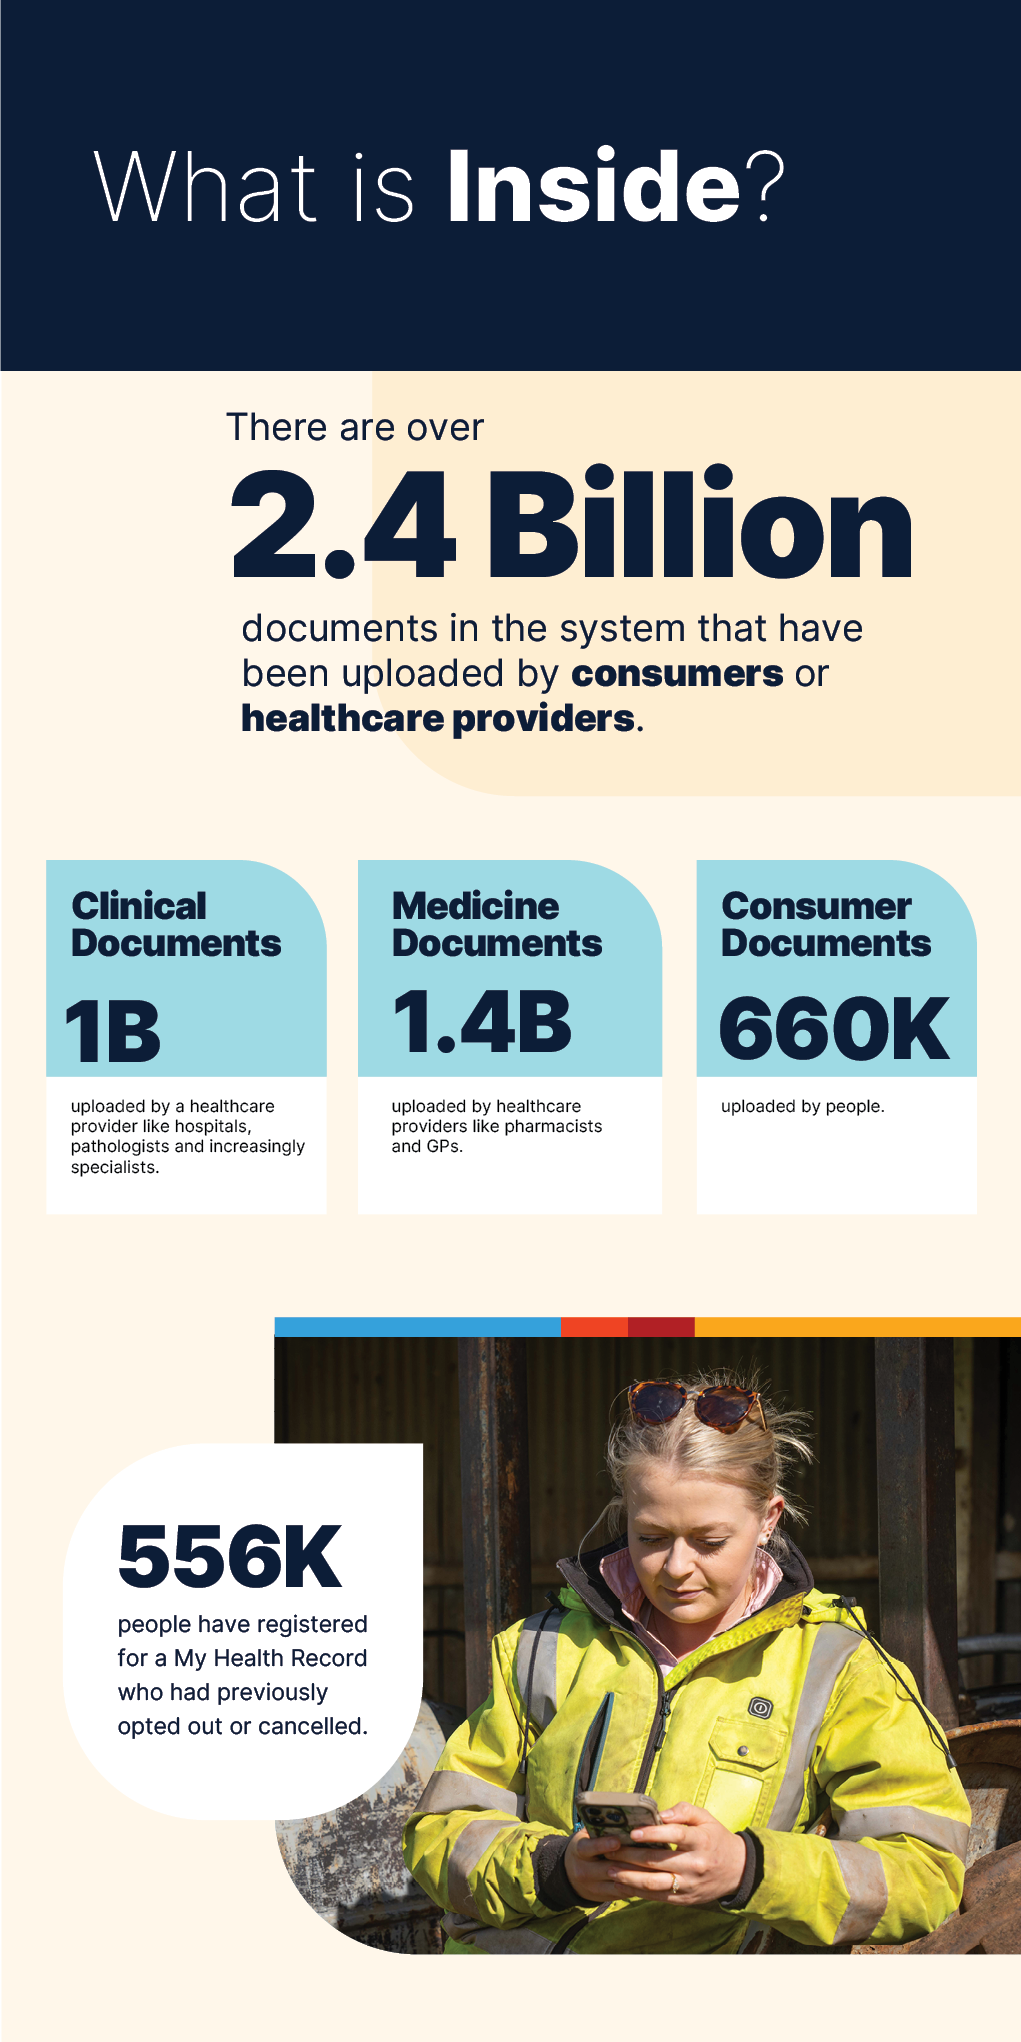
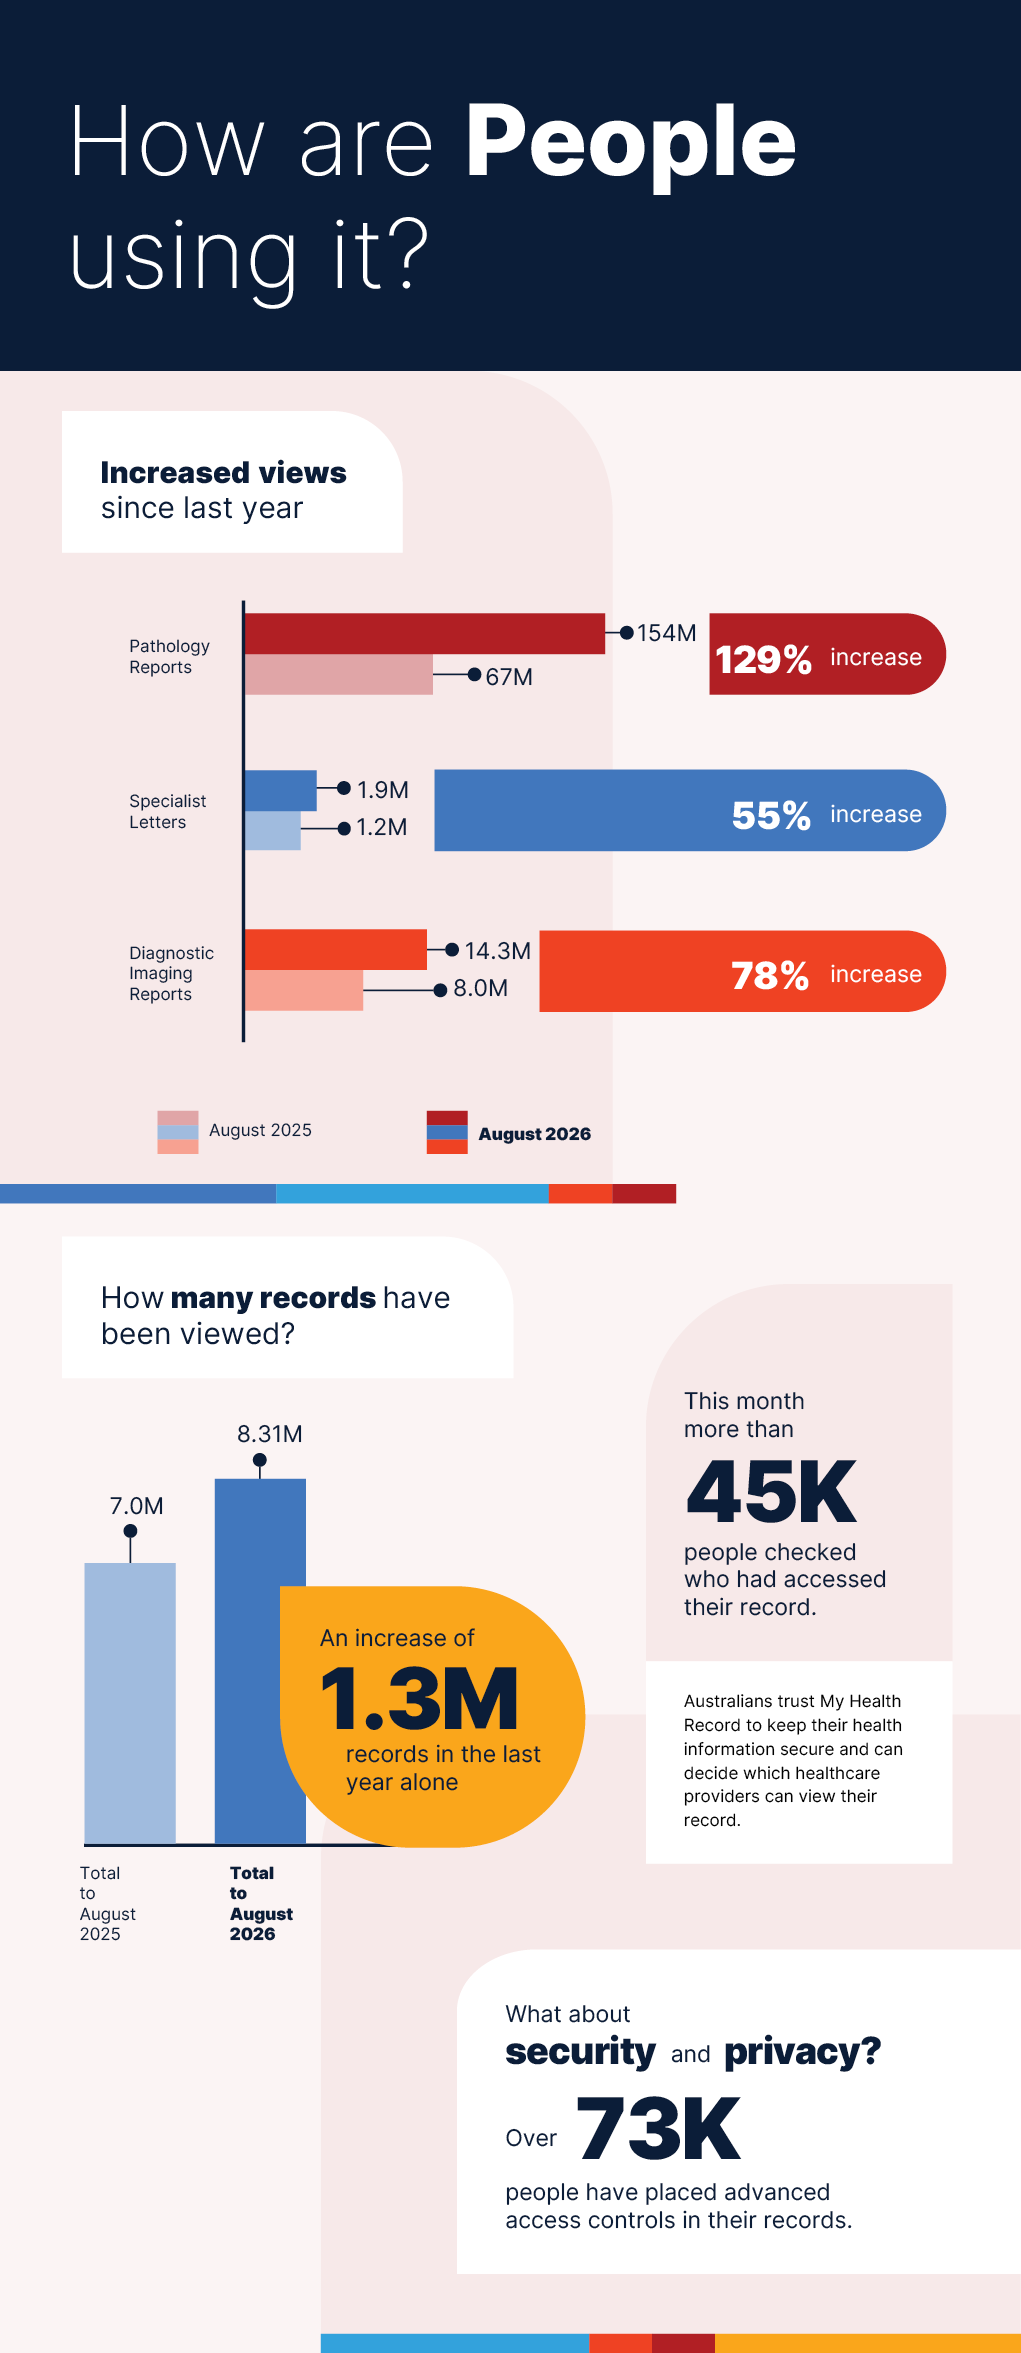
The big picture | What is inside? | How are people using it? | How are healthcare providers using it?
August 2026 Update
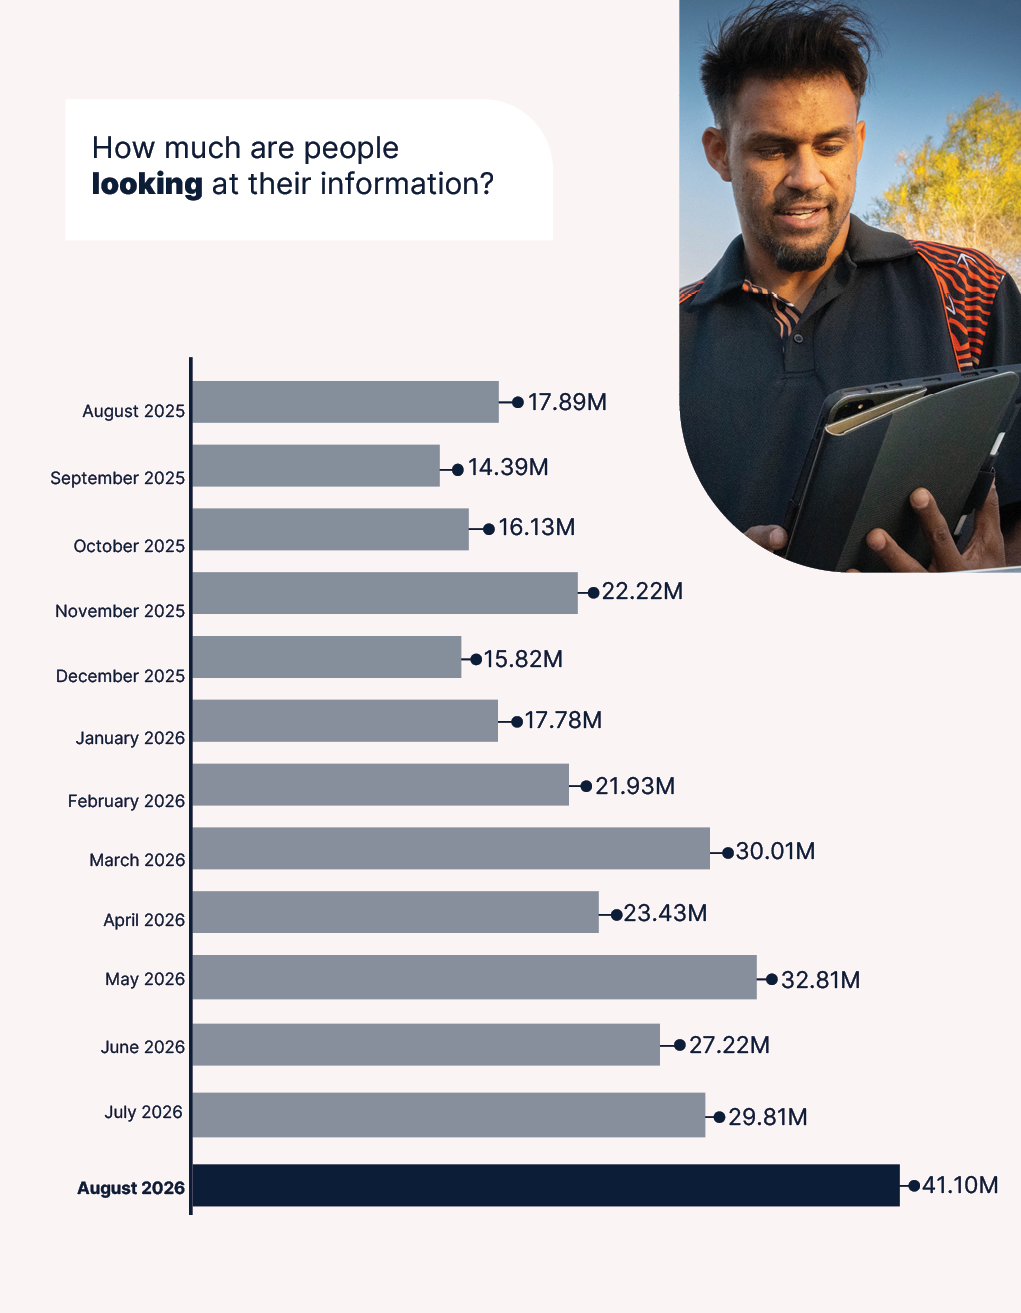
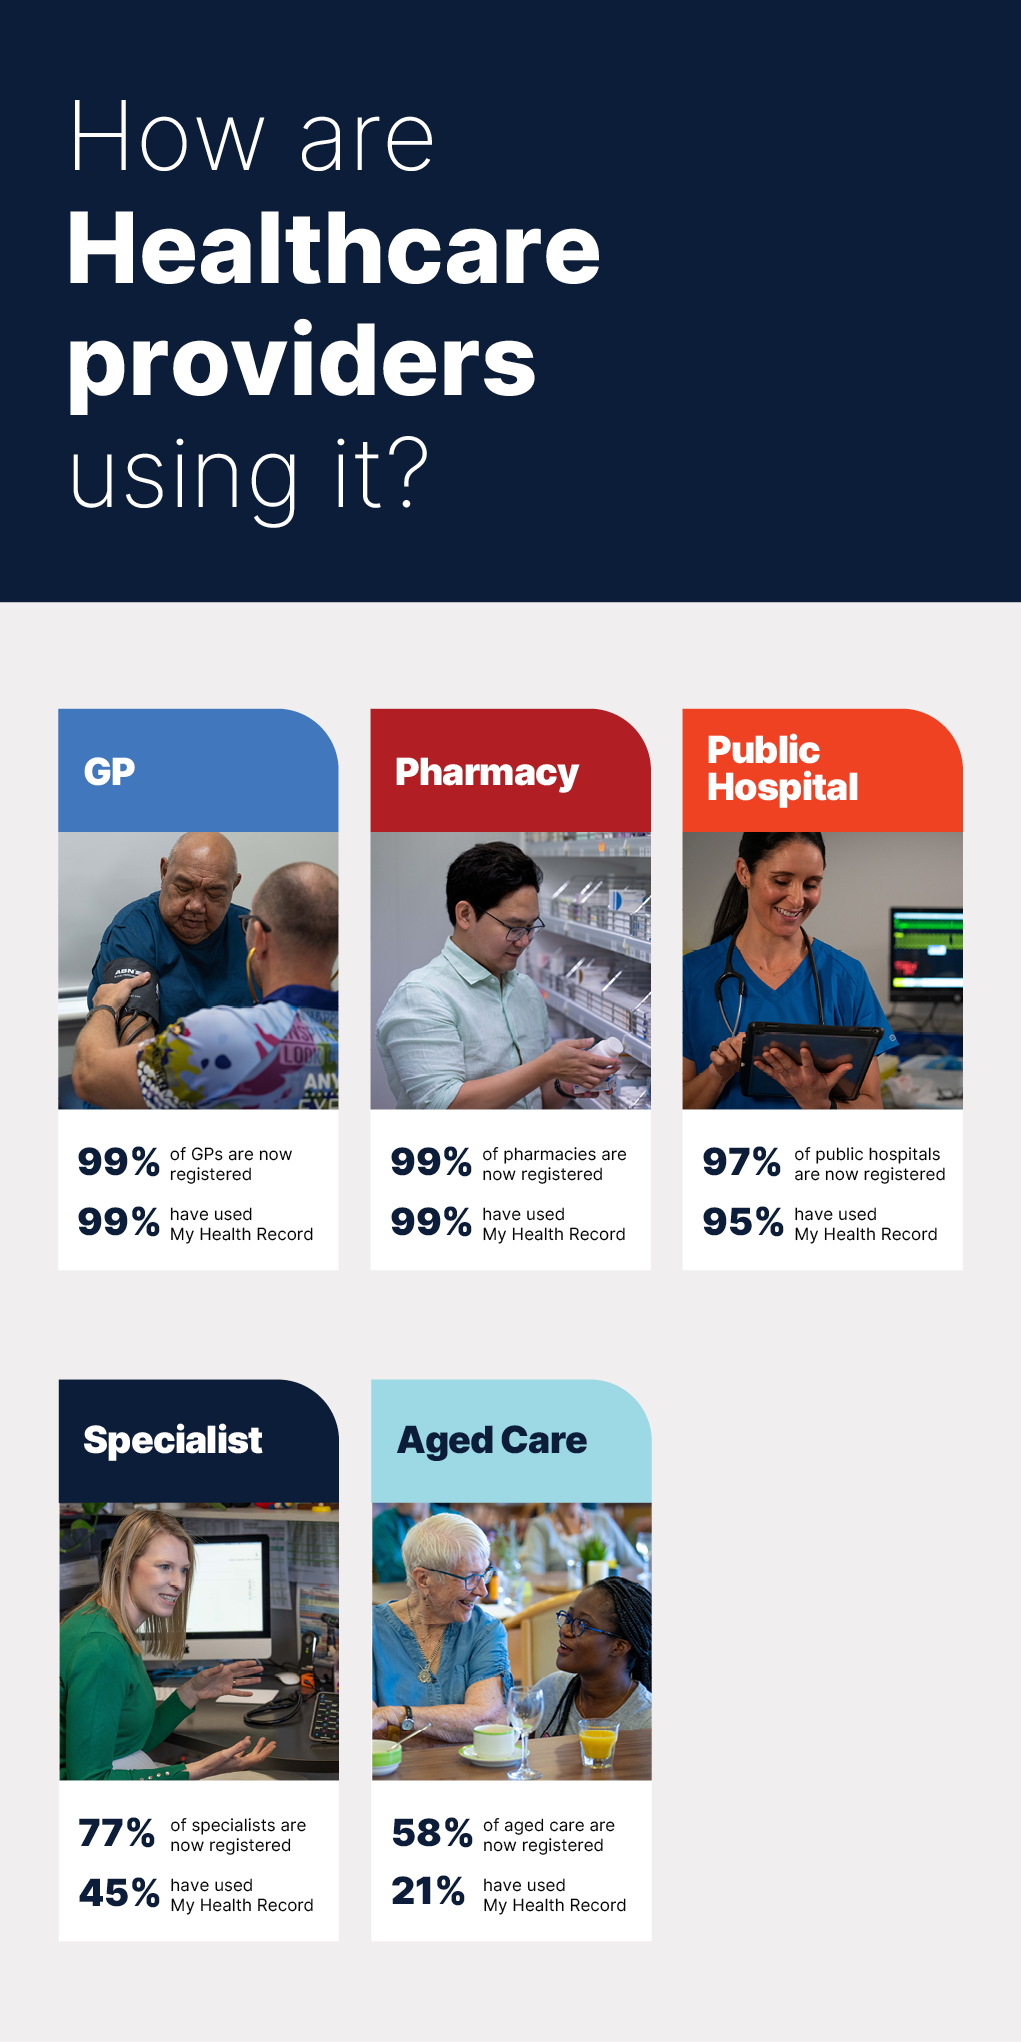
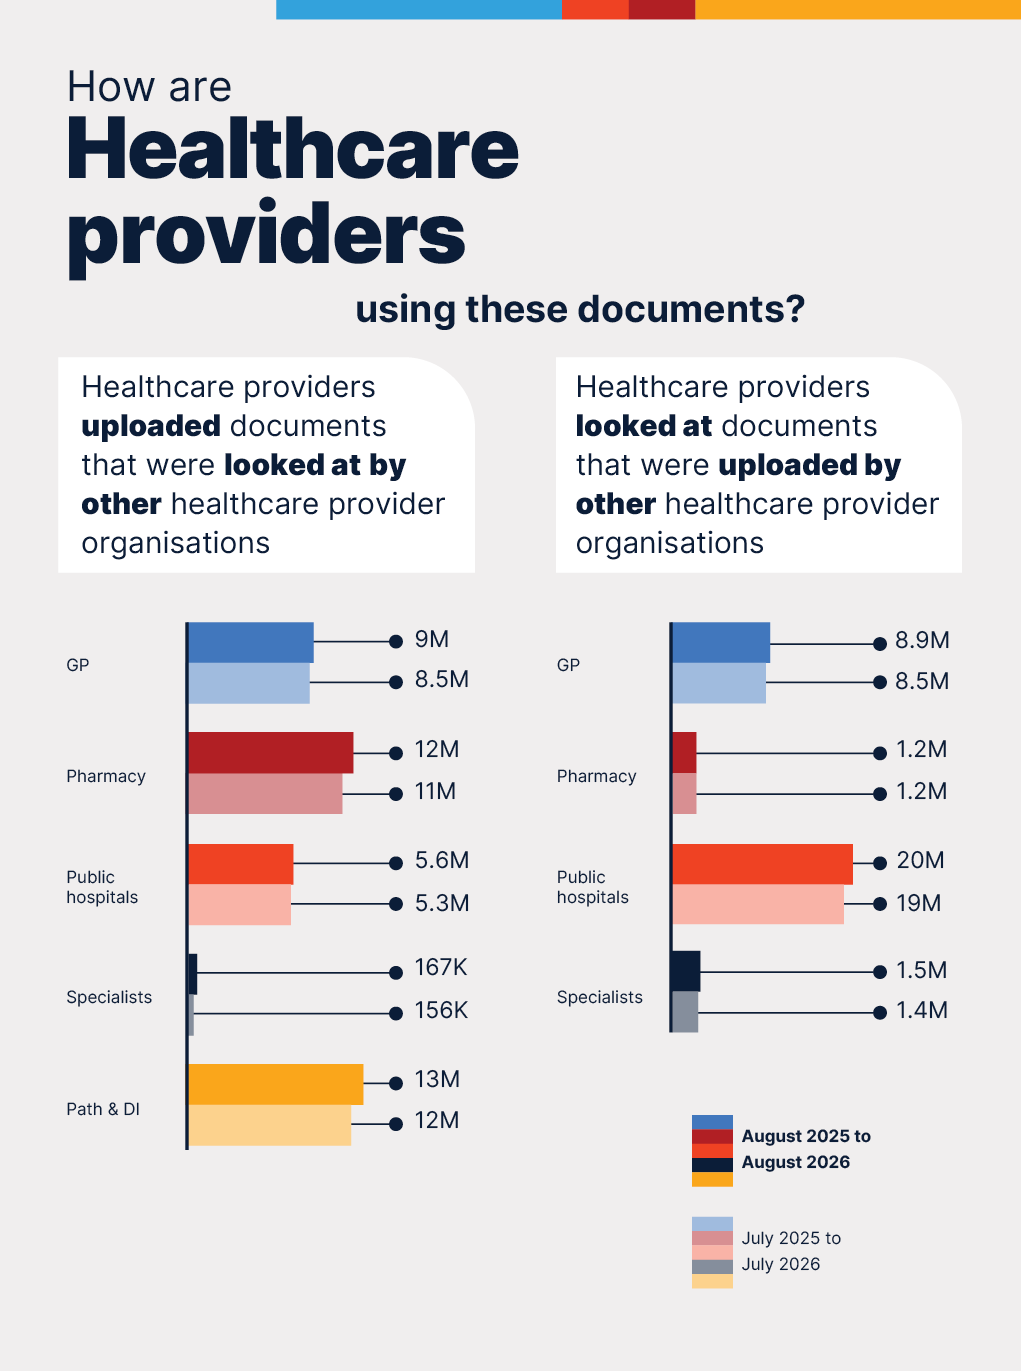
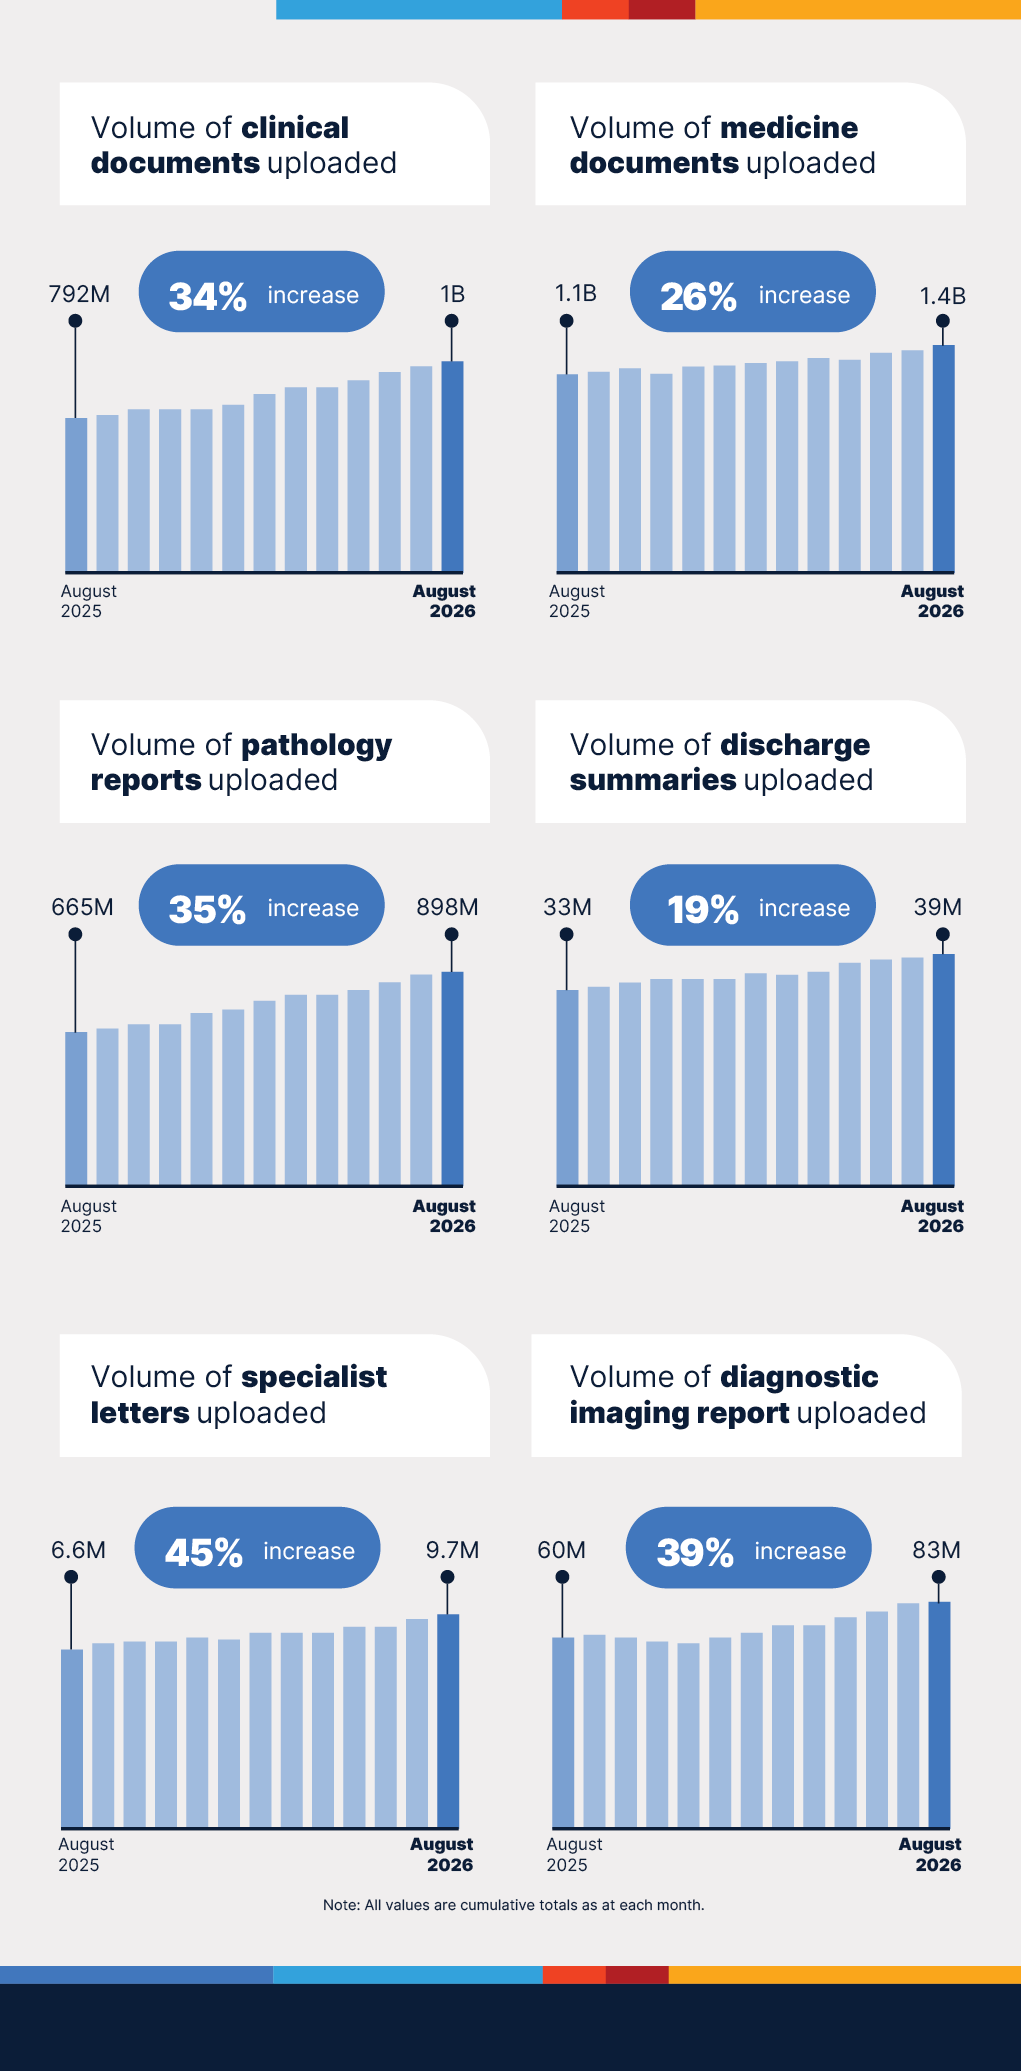
Download statistics and insights from previous months
2026
2025
- December 2025 (PDF, 1.56 MB)
- November 2025 (PDF, 1.55 MB)
- October 2025 (PDF, 1.56 MB)
- September 2025 (PDF, 1.59 MB)
- August 2025 (PDF, 1.59 MB)
- July 2025 (PDF, 1.51 MB)
- June 2025 (PDF, 1.59 MB)
- May 2025 (PDF, 1.58 MB)
- April 2025 (PDF, 1.6 MB)
- March 2025 (PDF, 1.53 MB)
- February 2025 (PDF, 1.59 MB)
- January 2025 (PDF, 1.55 MB)
2024
- December 2024 (PDF, 1.55 MB)
- November 2024 (PDF, 1.55 MB)
- October 2024 (PDF, 1.55 MB)
- September 2024 (PDF, 1.55 MB)
- August 2024 (PDF, 1.37 MB)
- July 2024 (PDF, 1.56 MB)
- June 2024 (PDF, 1.56 MB)
- May 2024 (PDF, 1.56 MB)
- April 2024 (PDF, 1.53 MB)
- March 2024 (PDF, 1.54 MB)
- February 2024 (PDF, 1.47 MB)
- January 2024 (PDF, 1.86 MB)
2023
- December 2023 (PDF, 8.07 MB)
- November 2023 (PDF, 7.63 MB)
- October 2023 (PDF, 8.06 MB)
- September 2023 (PDF, 8.06 MB)
- August 2023 (PDF, 7.41 MB)
- July 2023 (PDF, 6.67 MB)
- June 2023 (PDF, 6.79 MB)
- May 2023 (PDF, 8.02 MB)
- April 2023 (PDF, 7.78 MB)
- March 2023 (PDF, 7.78 MB)
- February 2023 (PDF, 7.39 MB)
- January 2023 (PDF, 2.98 MB)
2022
- December 2022 (PDF, 1.29 MB)
- November 2022 (PDF, 7.14 MB)
- October 2022 (PDF, 7.15 MB)
- September 2022 (PDF, 7.15 MB)
- August 2022 (PDF, 7.8 MB)
- July 2022 (PDF, 7.58 MB)
- June 2022 (PDF, 7.52 MB)
- May 2022 (PDF, 6.23 MB)
- April 2022 (PDF, 7.61 MB)
- March 2022 (PDF, 7.53 MB)
- February 2022 (PDF, 7.63 MB)
- January 2022 (PDF, 6.11 MB)
2021
2020
- December 2020 (PDF, 1.95 MB)
- November 2020 (PDF, 1.95 MB)
- October 2020 (PDF, 1.79 MB)
- September 2020 (PDF, 1.82 MB)
- August 2020 (PDF, 1.8 MB)
- July 2020 (PDF, 1.33 MB)
- June 2020 (PDF, 1.83 MB)
- May 2020 (PDF, 1.73 MB)
- April 2020 (PDF, 1.47 MB)
- March 2020 (PDF, 1.53 MB)
- February 2020 (PDF, 1.47 MB)
- January 2020 (PDF, 1.33 MB)